
Latest Posts

Why Your Singapore Business Needs an ERP Disaster Recovery Plan Now

How to Align ERP Modules with Singapore’s IRAS e-Invoicing Requirements in 2026

How Singapore Manufacturers Can Cut ERP Implementation Time by 40%

How Singapore’s Financial Sector Achieved 60% Faster Compliance Reporting with Intelligent Automation
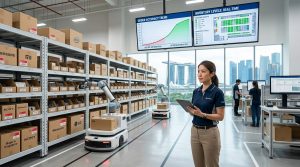
How a Singapore Electronics Distributor Tripled Order Accuracy with Automated Inventory Planning

Why Process Automation Projects Fail in Singapore and How to Avoid Common Pitfalls

5 Digital Transformation Myths Holding Back Singapore SMEs in 2026

A Step-by-Step Roadmap for Singapore SMEs Transitioning from Manual to Automated Processes